DEBUGGING A CUSTOM WORKFLOW ACTIVITY IN DYNAMICS 365 AND POWERAPPS
In the previous post, we created a new Custom Workflow Activity and used it in a workflow.
Let’s look at how to debug one of these.
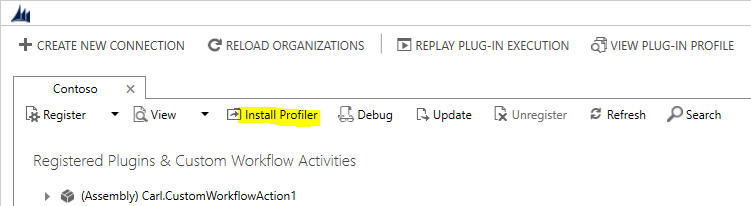
Open the Plugin Registration Tool (PRT) and select Install Profiler:
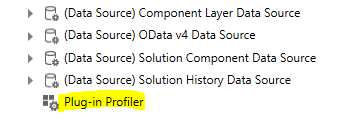
This may take a few minutes. Once installed, you will see the Plugin Profiler at the bottom of the list:
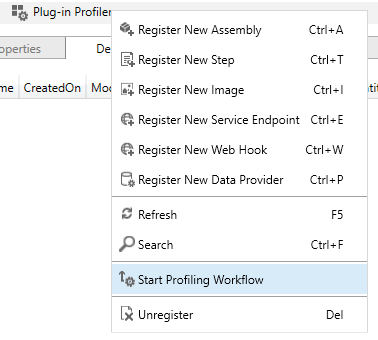
Right-click it and select Start Profiling Workflow:
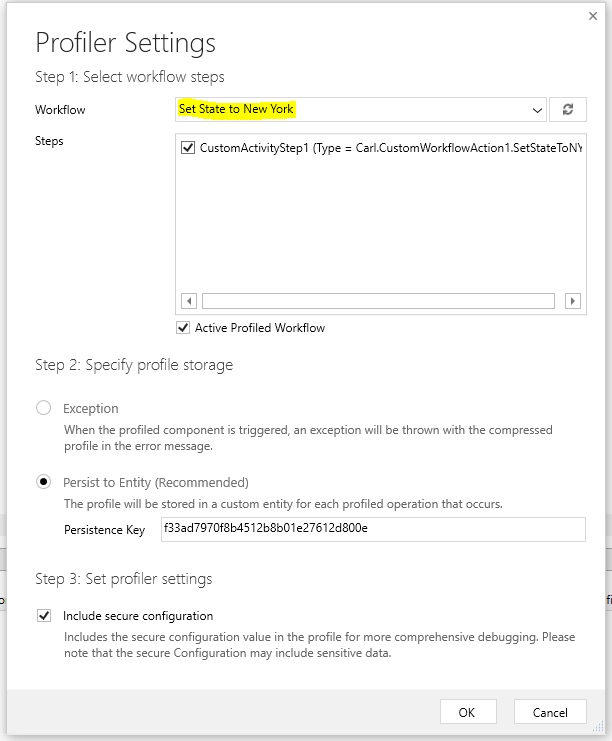
Find your workflow in the list and click OK:
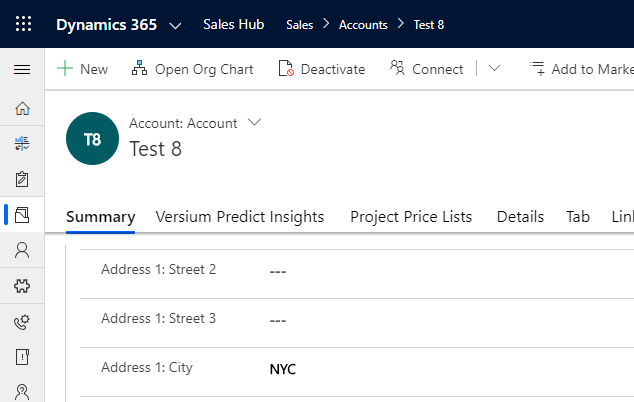
Now perform the action that runs the workflow custom activity. I.e. in our case we have a workflow running on saving the account with the city field populated.
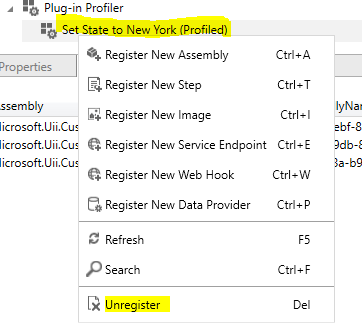
Once complete, expand Plug-in Profiler to find your profile and click Unregister:
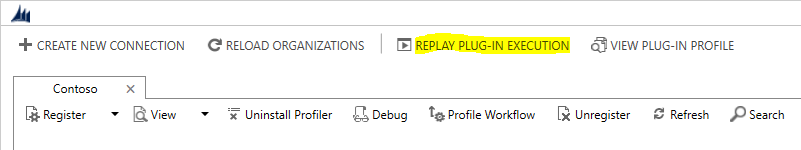
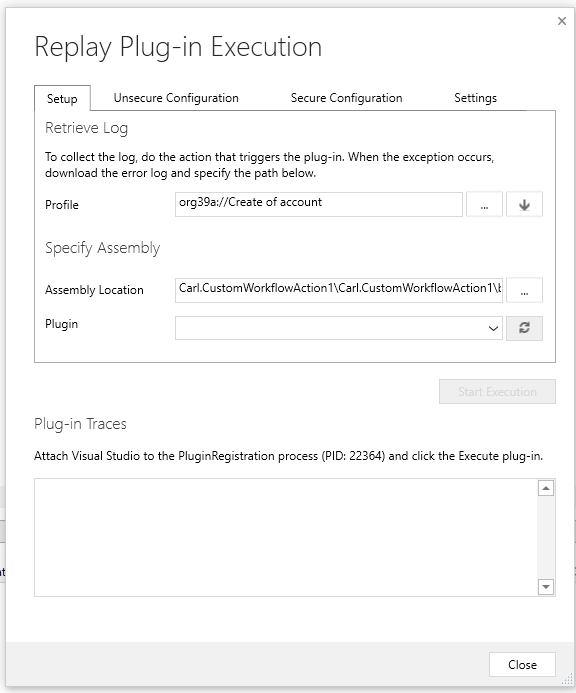
Now from the top, select Replay Plug-in Execution:
Select the
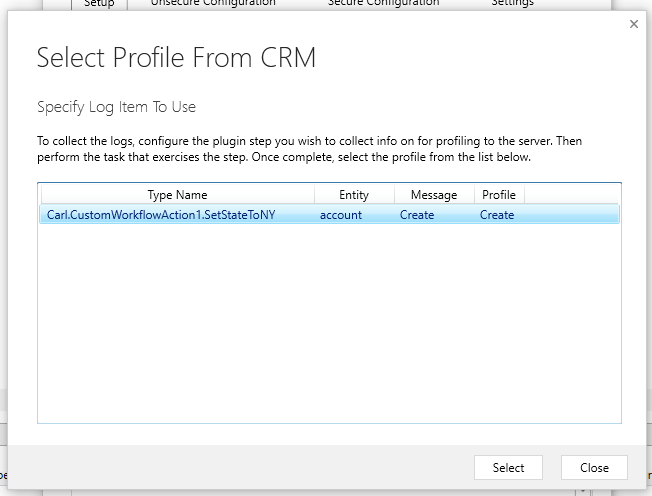
Select the assembly of the custom workflow assembly project
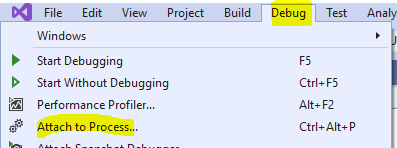
Now, jump over to your Visual Studio project for the custom workflow, select Debug then Attach to Process:
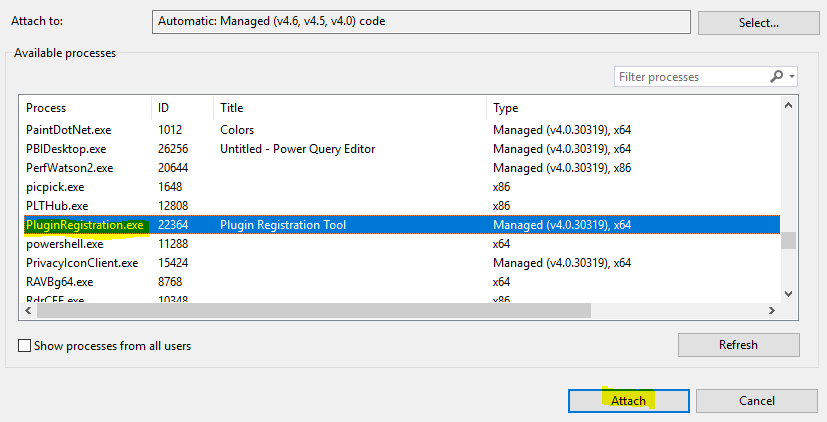
Find the PluginRegistrationTool and click Attach:
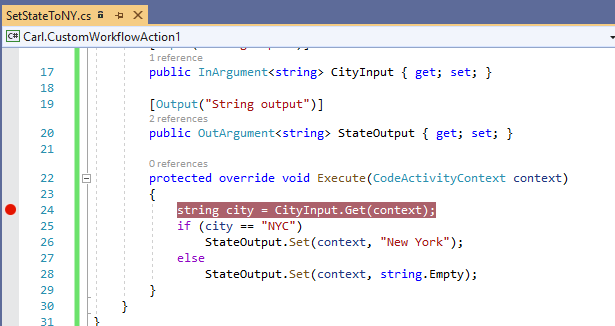
Add a breakpoint in the Execute method:
Back in the Plugin Registration Tool, click Start Execution:
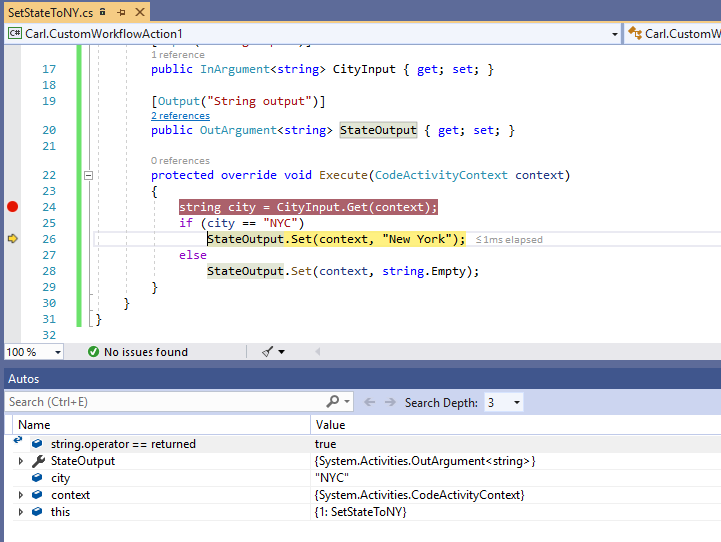
The breakpoint is hit, and you can start debugging:
No comments:
Post a Comment